
What?
Shrink your Data Reporting
![]()
Cut Thru the forest of board reports.
Focus on only high impacting trends
![]()
Shows you insights you would otherwise miss
The MISSING 80%

How Does It Work
Calculates the impact of KPI trends over time

. Herding the Cats
Transforms all your KPI's into a common unit of measure.
You can directly compare all of your KPI's

KPII explains 100% of the change in any process or measure
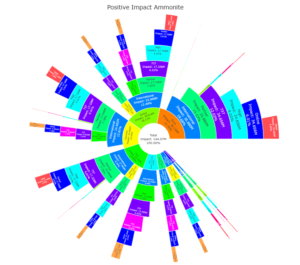
Shown in order of Impact

A new perspective of machine decisioning insight
Increases the precision, speed and agility of your decision-management processes

New Visuals and Drill Downs
Adds Cut thru to your existing analytics capability

KPI Reporting
Testing shows that Changealytics can change your reporting practices by up to 84%

Different Month, Same Sh*t ??
Wonder how ‘Data X-Ray’ works
no more trial and error click thru drill downs

CFOs
really know your numbers with Changealytics

 Subscribe to our YouTube Channel
 Changealytics
‘KPI IMPACT’ analytics
What is Changealytics KPII ?

“Revolutionary AI Analytics tool to find your MISSING 80%….. Directly compare all of your KPI trends even if they have different units of measure. Our KPII’s X-ray your Corporate Performance Measures to show which are having the biggest impact both positive of negative….”
Put simply it shows the impact on business performance of every KPI trend (‘KPI Impact’).


Or when used in a process context, it shows the impact of each process step on the final process outcome.
How Does It Work?

Changealytics uses a patented ‘process flow’ approach;
It determines the impact of each process KPI on the process outcome;

You don’t need perfect data – use what you have;

Changealytics evaluates the KPI Impact (‘KPII’ of each step of the process);
You can see what really drives
each of your processes.


Data haystacks now cover the open plains of the new data frontier,
things turned sour….. so now
It is even harder to find your undefined needle in the ever-expanding haystacks
So What’s Different ?
Evaluates the wider impact of every
KPI Trend (‘KPII’)

Ground-breaking Insights
Top 5 impacting KPI trends

Use KPI Impact to avoid missing critical underlying trends

New visualisations using
KPII

Avoid offsetting errors using
KPII

| Criteria | Traditional approach with all other tools | ChangeAlytics.AI | The ChangeAlytics.AI DIfference |
|---|---|---|---|
| Basis of reporting | KPI Trends. Values over time | KPI Trends PLUS the KPII The Impact of KPI Trends on corporate performance | Automatically identify trends and quantify their Importance and Impact using KPII. |
| Evaluation of Importance | KPI Trends using maintainable red/amber/green rules | KPI Trends PLUS KPII of each trend | Exact automated calculation (to 3 decimal places) of the Impact of the Trend. No need for rule set maintenance |
| Basis of Investigation | Trial and Error drill downs /click through. Analyst driven. Time bound typically covering <1% of your data | Top "X" prioritised drill downs pre evaluated by ChangeAlytics.ai using KPIIs for 100% KPI trends | AI unearths 100% of all data trends and reports over 100x faster than you can |
| Visualisation and Reporting | Multiple often manual visualisations for each KPI trend in its own unit of measure | Single visualisations showing KPIIs for allKPI trends impacting on an area of corporate performance | Shorter, Faster, cheaper for Boards and C-suite |
| Risk | Reduces errors - Analysts can miss hidden "offsetting" trends | Avoids Offsetting errors using KPII | Lowers risk of missing something..... as well as your promotion !! |
Add KPI Impact insights to your current analytics app

Are you ready for the next level ? …Changealytics.com
…Analytics with Artificial Intelligence.
- NEW Evaluate KPI Impact …..report better, faster, cheaper
- NEW Look ‘through the data’ using ‘Data X-Ray’ – no more click thru drill downs
- NEW AI generated reporting.
- NEW multi layer visualisations to reduce report sizes
The cost of being a Leader thru Analytics with AI is just $x per month. Are you ready ?
